
Financial health score overview
Financial health score overview
Understanding how you're tracking with your money has never been easier. In this guide, we’ll walk you through how the Financial Health Score works, how to access it, and what each part of it means — so you can stay on top of your finances and make smart progress.
1. A quick summary
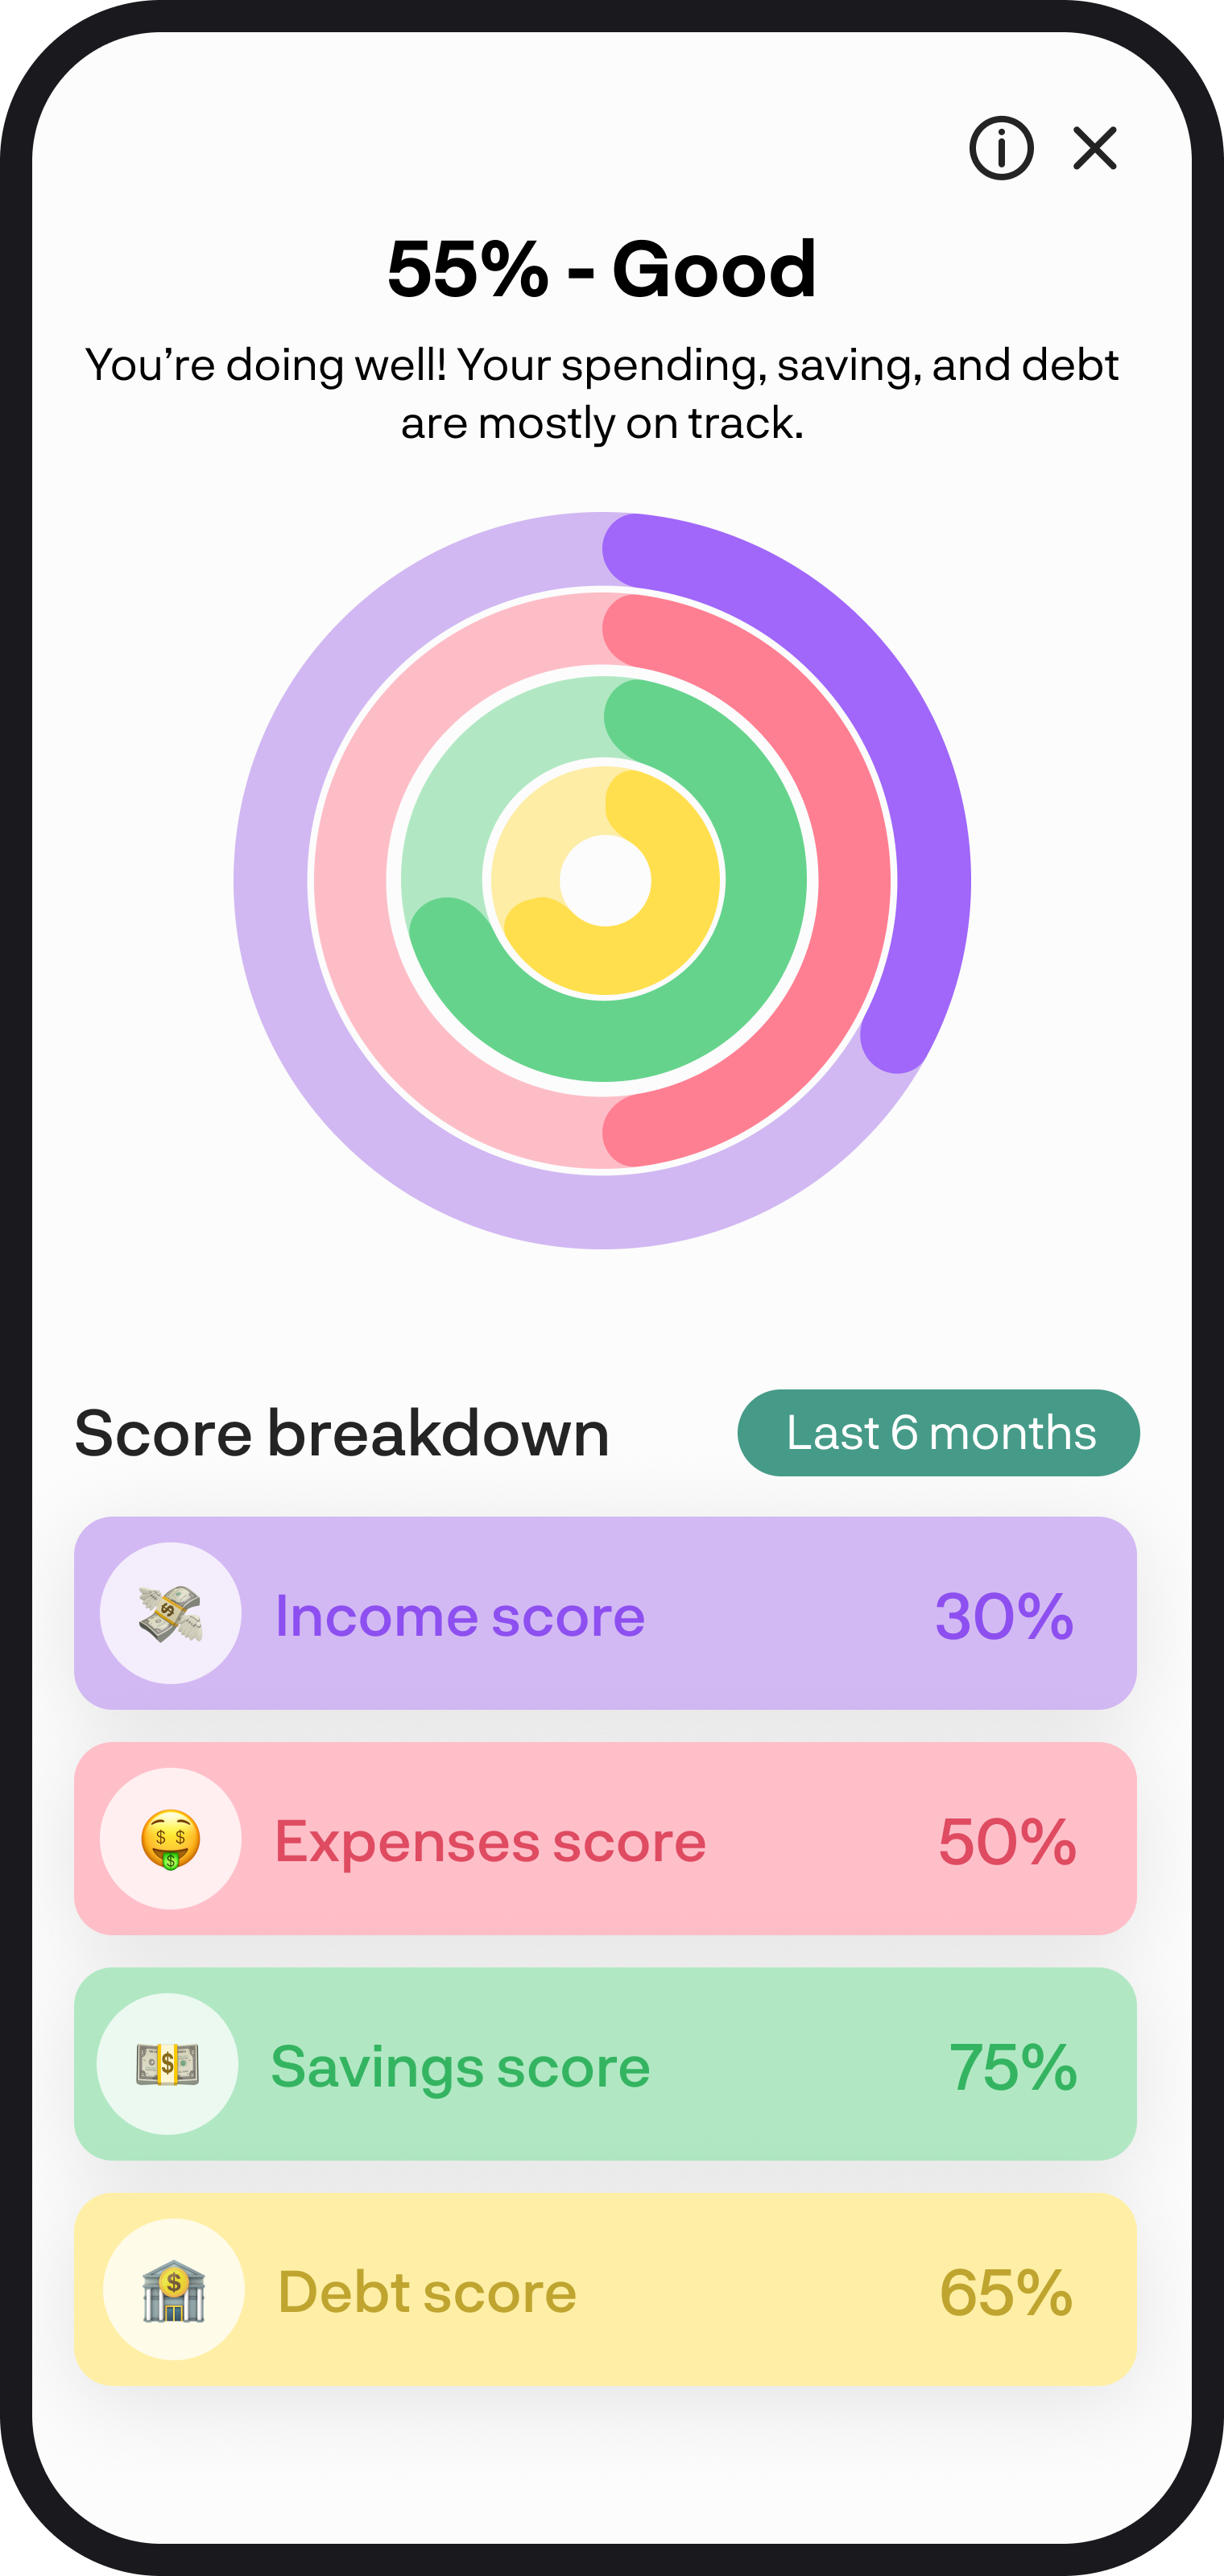
Your Financial Health Score gives you a simple percentage rating out of 100%, based on how you're doing across four key areas: income, expenses, savings, and debt. Each area is represented by a coloured ring and scored individually, then combined into an overall average.
This score is based on your actual activity over the time period option you select, helping you see the bigger picture and know exactly where to improve. The score is to be used as a guide only.
2. Where to find it
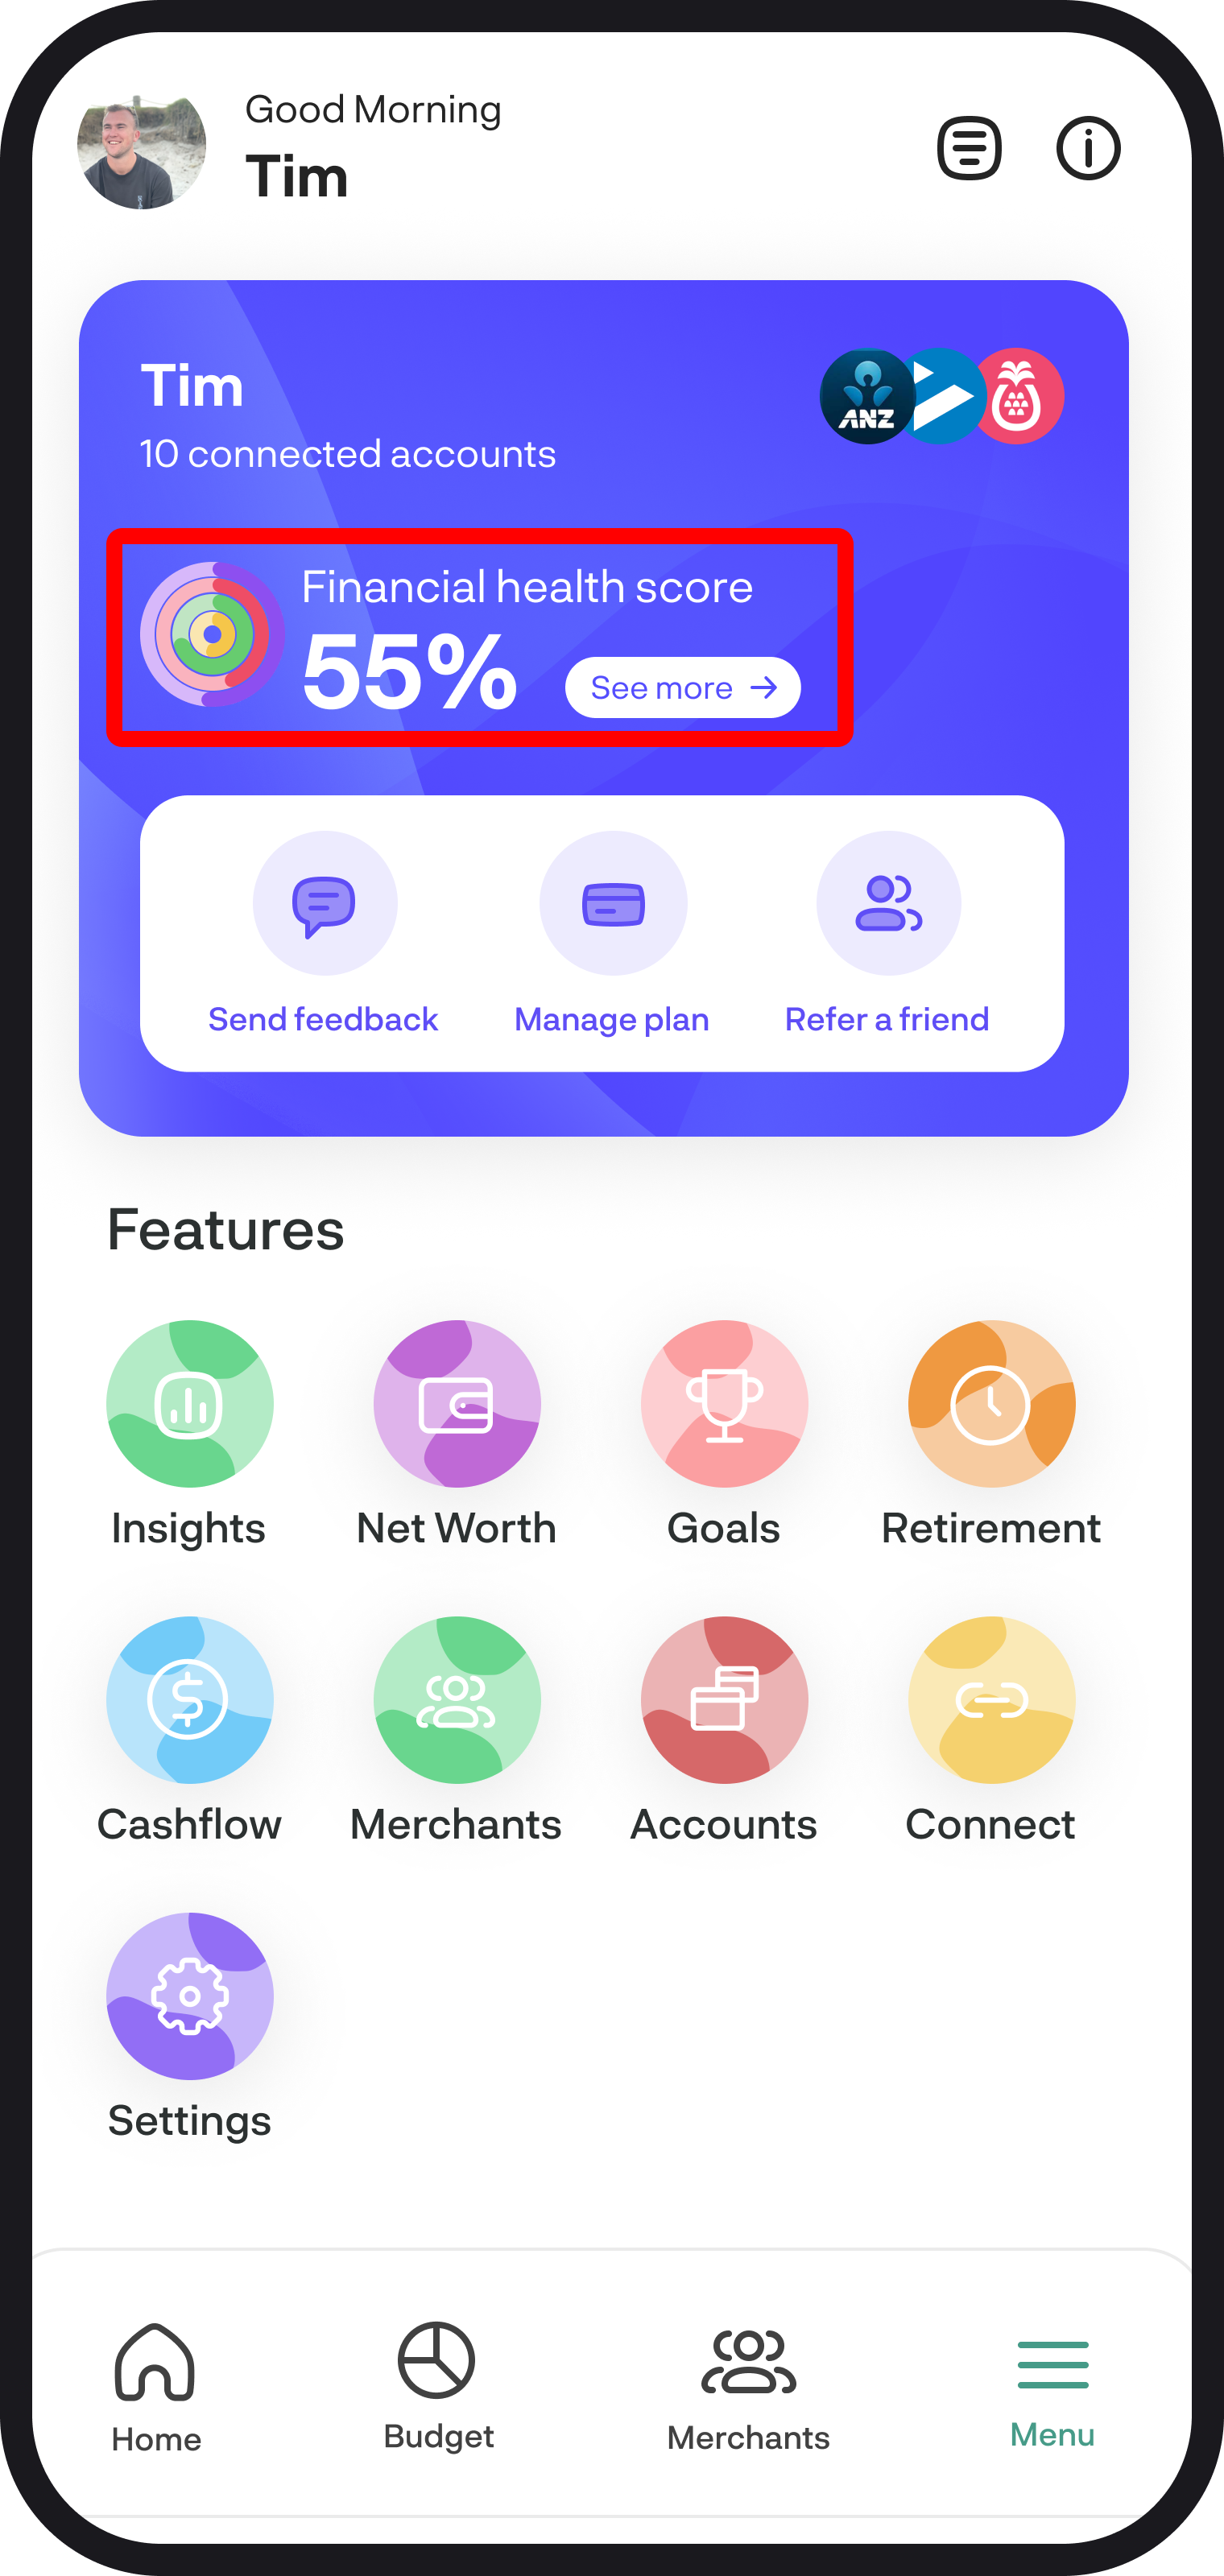
You’ll see your Financial Health Score at the top of your Menu screen, just under your name and account connections.
To see a full breakdown, tap “See more →”, and this will take you to the detailed view showing each score and its colour-coded ring.
3. What the colours mean
Each ring represents a different area of your finances:
- 🟣 Income – How consistent your income is and if its growing and whether it covers your expenses
- 🔴 Expenses – How much of your income you're spending
- 🟢 Savings – How much of your income you're saving
- 🟡 Debt – Whether you’re taking on new debt compared to your income
The fuller the ring, the better you’re doing in that area.
4. Toggling different time periods
At the top right of the detailed breakdown, you’ll see a green tile that says something like “Last 6 months.” To change the time period, simply tap that tile and you’ll see options like:
- Last 3 months
- Last 6 months
- Last 12 months
Tap the one you’d like, and your score will update automatically based on that timeframe.
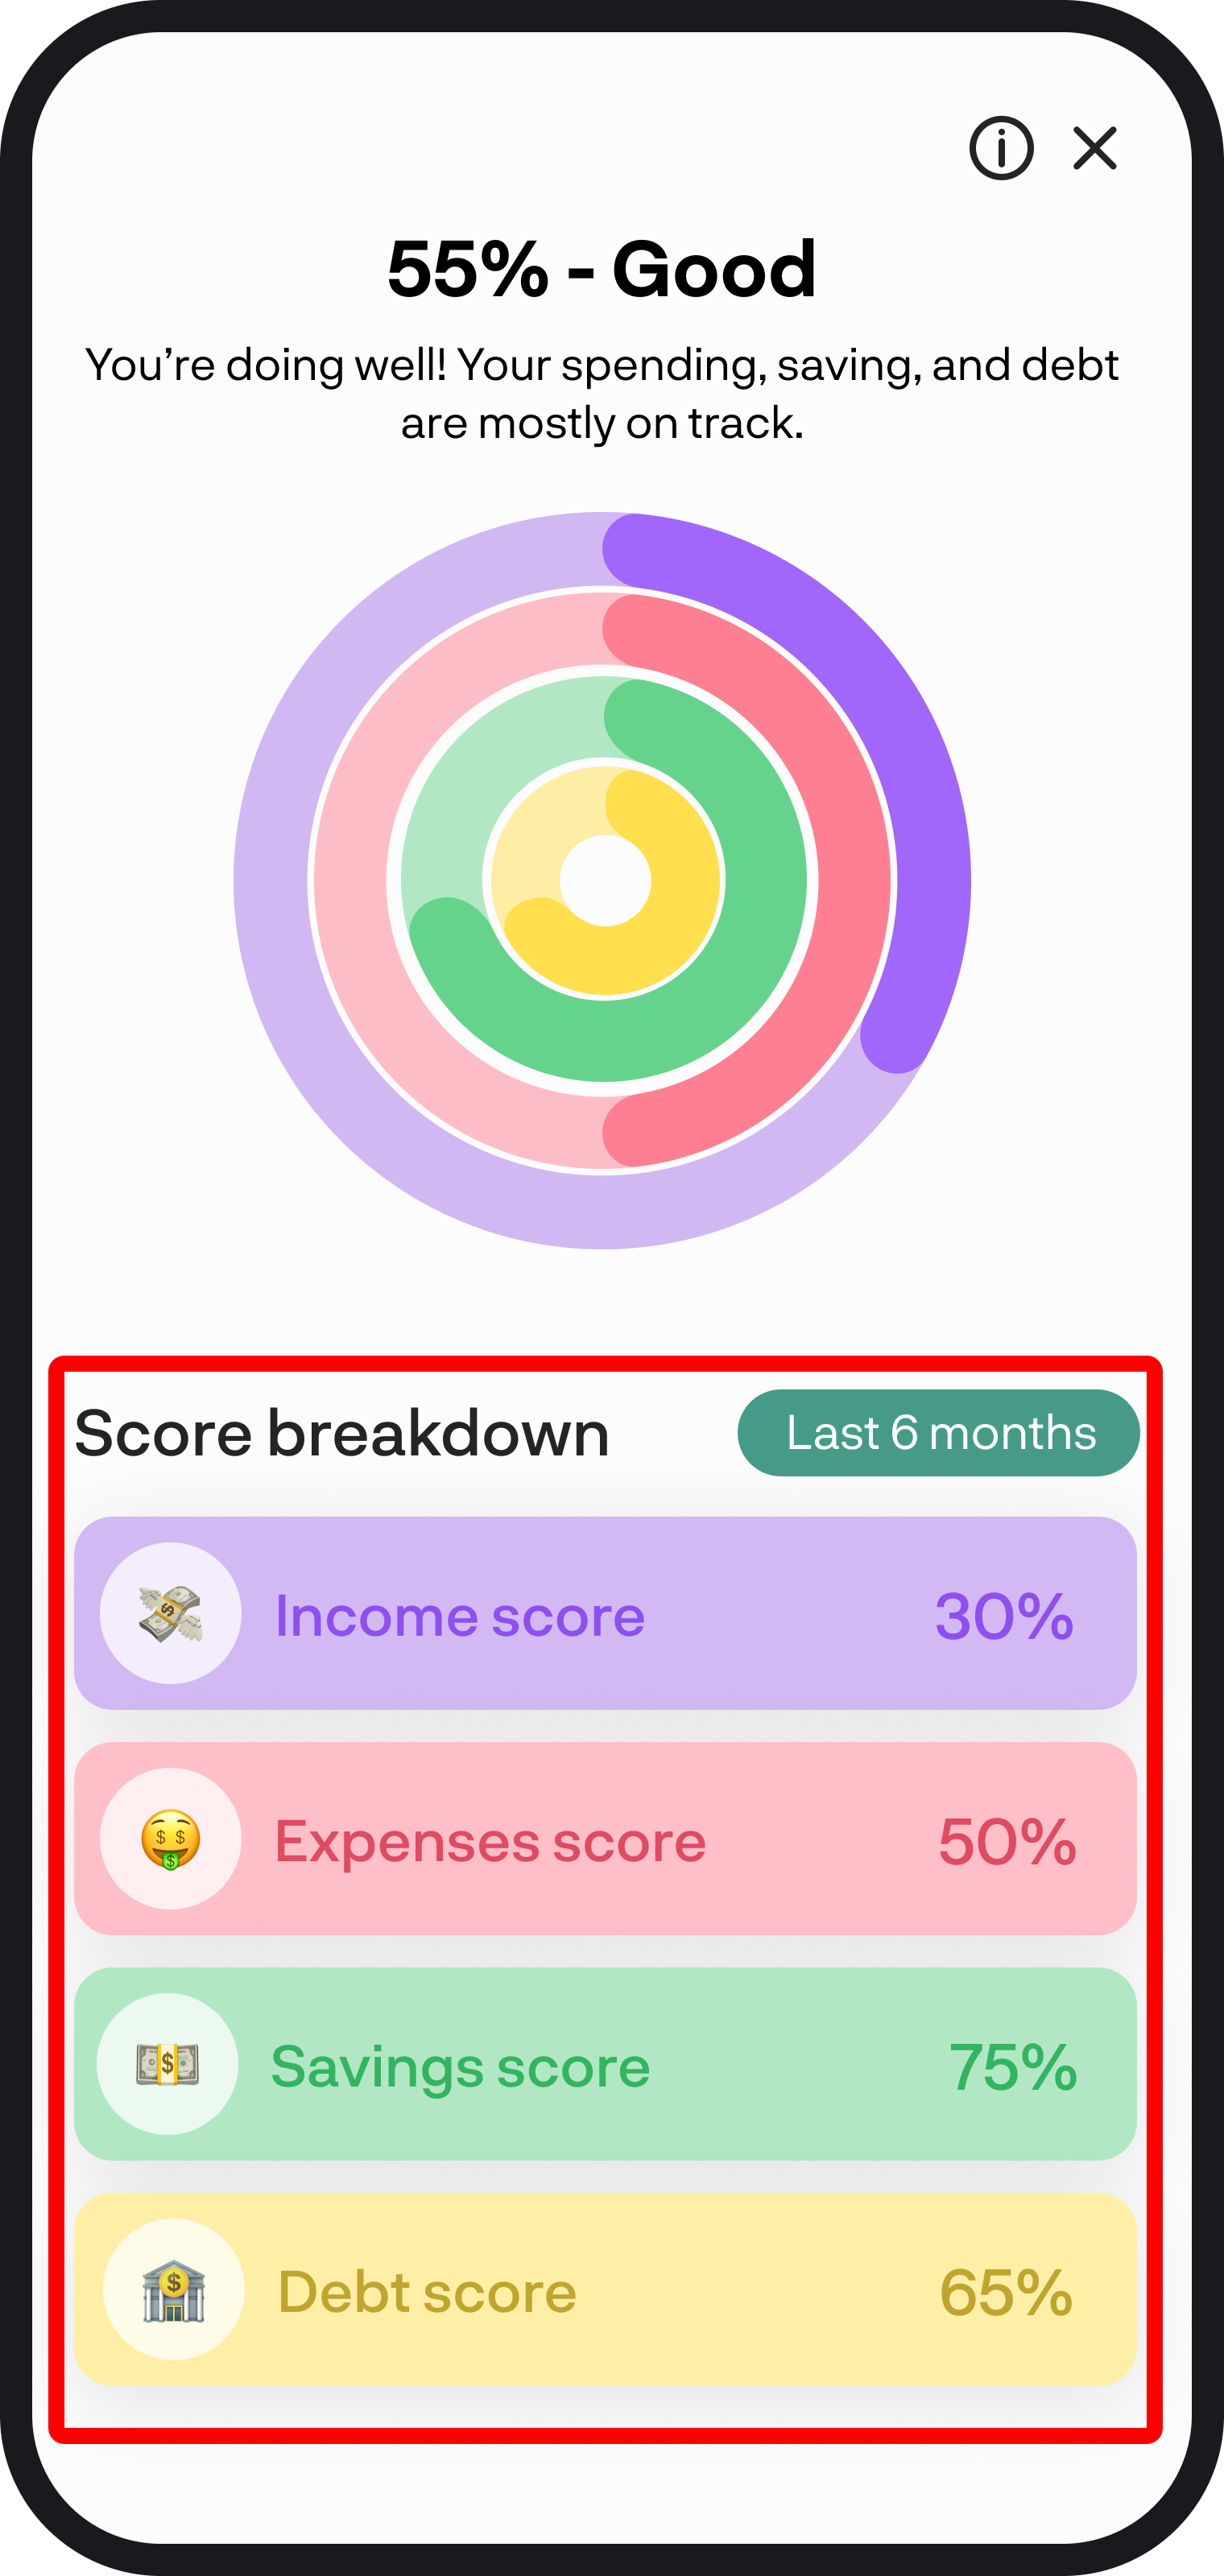
5. How each score is calculated
Your Financial Health Score is made up of four key areas. Each one is scored monthly based on your real activity, then averaged over the selected time period. Here's a quick breakdown:
Income Score
Looks at whether your income is consistent, growing, and if it regularly covers your expenses. A higher score means you’re earning more than you spend and your income is trending steadily or increasing over time. A lower score means your income is irregular or often falls short of your spending.
Expense Score
Measures how much of your income you're spending. It compares total spending to income, lower spending relative to income results in a higher score. If you’re consistently spending close to or more than you earn, this will reduce your score.
Savings Score
Calculates your savings rate by comparing your income to expenses. The more of your income you're saving, the higher your score. Saving 20% or more regularly boosts your score, while saving very little or spending more than you earn, lowers it.
Debt Score
Looks at how much new debt you're taking on compared to your income. If you’re not adding new loans or credit, you’ll maintain a strong score. If you regularly borrow large amounts relative to what you earn, the score will dip.
You're all ready to go 🎉
Woohoo you're all set! Your Financial Health Score is a powerful way to stay focused and make small improvements that lead to big results over time. If you run into any issues, feel free to get in touch with us at hello@budgetbuddie.co.nz.